Miles per kWh: How to Measure Your EV’s Real Efficiency (and What MPGe Leaves Out)
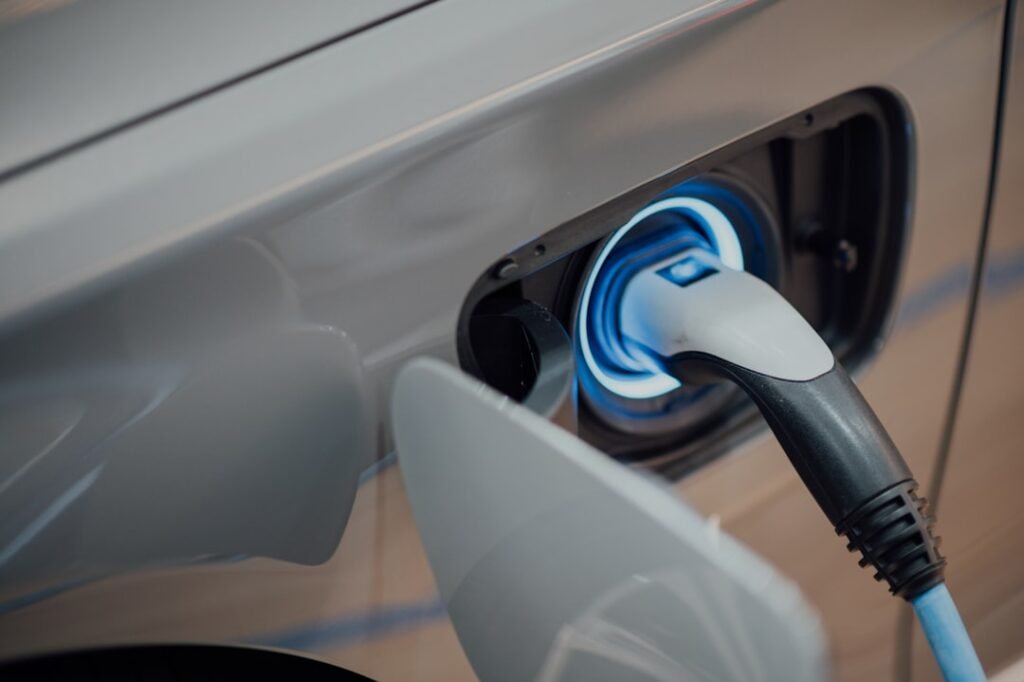
If you drove a gas car for years, you learned to ignore MPG most of the time — it was a number on a screen, not something you acted on. With an electric car, the equivalent number matters far more, because miles per kWh is three things at once: it’s your real range, it’s what a mile actually costs you, and it’s the first place a failing battery or a dragging brake shows up. And almost everyone reads it off the dashboard, which — for a reason gas drivers never had to think about — quietly flatters it.
I build Magica, a mileage and vehicle app, so I spend a lot of time looking at charging data people actually record. The math is trivial. The measurement has one trap that’s specific to EVs and catches nearly everyone. Here’s the formula, the trap, what MPGe really tells you, and what a good number looks like in 2026.
The metric, and the only two numbers that matter
Efficiency is a ratio between distance covered and energy used to cover it:
Efficiency = miles driven ÷ kWh used
Report it that way and you get miles per kWh (mi/kWh), where higher is better — the direct electric cousin of MPG. Flip it and you get kWh per mile (or Wh per mile, the same thing ×1000), where lower is better. They’re the same fact in two directions, exactly like MPG and L/100 km. More on converting between them below.
The miles are easy: the odometer, or the trip meter. The energy is where it goes wrong — not because kWh are hard to read, but because there are two different amounts of energy in play, and the car shows you the flattering one.
The trap gas cars never had: the wall vs the battery
When you fill a gas tank, the gallons the pump delivers are the gallons that end up in the tank. There’s no meaningful loss between the nozzle and the fuel. Charging is not like that. Charging an EV is not 100% efficient — some of the energy that leaves the wall socket never reaches the battery. It’s lost as heat in the onboard charger, the cable, the charging unit, and the battery’s own thermal management.
So there are two honest efficiency numbers, and they’re genuinely different:
- From the battery — miles divided by the kWh that came *out of the battery* to move the car. This is what your dashboard shows. It’s the higher, prettier number.
- From the wall — miles divided by the kWh you actually *drew from the socket* to put that charge back. This is lower, and it’s the one that decides your electricity bill and your true cost per mile.
How big is the gap? In U.S. Department of Energy testing (Idaho National Laboratory), a Level 2 onboard charger ran about 92% efficient — roughly 8% lost as heat in that one stage alone, before you count the wall unit, the cable and battery conditioning. Real wall-to-battery losses on home AC charging commonly land in the low double digits.
This isn’t a fringe detail — it’s exactly why the EPA measures the way it does. On the window sticker, EV efficiency is deliberately measured from the socket, not the battery: *”MPGe values provided by EPA include charging losses… This moves the measurement from the vehicle to the outlet in the wall to better represent how much users would pay to refuel their car”* (EPA — Fuel Economy and EV Range Testing).
The practical rule: decide which number you’re measuring, and be consistent. The dashboard figure is fine for tracking trends. When the number is going to decide something — comparing two cars, estimating a road trip, checking whether your costs make sense — measure from the wall.
How to measure it, charge to charge
The reliable method mirrors the tank-to-tank method for a gas car, with the wall standing in for the pump:
- Charge to a level you can repeat. Charging to 100% every time is the easiest reference, but if you keep the car at an 80% daily limit, use *that* as your consistent ceiling. The point is a repeatable start and end state.
- Note the odometer at that charge. Trip meter reset, or write down the total.
- Drive normally. Don’t baby it for the measurement week — you’ll describe a driver who isn’t you.
- Read the kWh from the wall, not the car. Your home charger’s app, the public station’s receipt, or a plug-in energy meter all report energy *delivered from the socket*. That figure includes the charging losses, which is the honest one for cost.
- Divide miles by kWh. That’s your real, wall-basis miles per kWh for that stretch.
Worked example, with numbers off a home charger:
- Miles since the last charge: 212
- Energy drawn from the wall to refill: 60 kWh
- 212 ÷ 60 = 3.53 mi/kWh
The car’s dash, over the same 212 miles, might read 4.0 mi/kWh — because it only counted the ~53 kWh that actually reached the wheels, not the 60 you paid for. That’s a 12% gap, and it’s real: it’s the charging loss, and it’s on your bill. Neither number is lying — they’re answering different questions.
Don’t average your averages
Once you have several charges, the instinct is to average the mi/kWh figures. That gives a slightly wrong answer, and it’s worth thirty seconds to see why — because with an EV the error runs the opposite way you’d expect.
Say you do a 300-mile highway run at 2.8 mi/kWh (107 kWh), then a 60-mile week of city errands at 4.5 mi/kWh (13 kWh). Notice the city figure is *higher* — regenerative braking and low speeds make EVs more efficient in town, the reverse of a gas car. Average the two results and you get 3.65 mi/kWh. Add up what actually happened — 360 miles on 120 kWh — and you get 2.99 mi/kWh. Two-thirds of a mile per kWh apart, from the same two charges.
The averaged number is wrong because it treats the 60-mile week as equal in weight to the 300-mile trip. Your battery discharged in proportion to the miles, not to how many times you plugged in. The fix is the same as for any efficiency figure:
Overall efficiency = (total miles across all charges) ÷ (total kWh across all charges)
Keep a running total, not a list of results. Record the raw facts, derive the summary later — never the other way round.
Why your dashboard efficiency disagrees with the wall
You now know the first reason: the dash counts energy *from the battery*, the wall counts energy *from the socket*, and the difference is charging loss. There’s a second reason on top of it — the dashboard number is itself an estimate, computed from motor current, speed, and how the software accounts for climate control and accessories. Like the gas fuel-economy display, it’s a good *trend* instrument and a poor *measurement*.
The same gap applies to the window sticker. The EPA rating is a standardized test with real-world adjustment factors, and the agency is upfront that those adjustments cover *”air conditioning use, cold temperature operation, and other real-world factors”* — none of which match your specific commute, climate or right foot. Treat the sticker as a way to compare cars, not as a promise about yours.
The gasoline side of the same label has the same problem, and the EPA publishes the evidence itself: alongside the official ratings it hosts what drivers report at the pump, and the two lists disagree. Both sets of 2026 numbers are in cars with the best gas mileage.
What counts as a good miles per kWh in 2026
There’s a real spread, and body style drives most of it. Using the EPA’s own ratings (fueleconomy.gov):
- Efficient sedans and compacts — a Lucid Air Pure or a rear-drive Tesla Model 3 sit around 23–25 kWh/100 miles, which is roughly 4 mi/kWh (about 135–145 MPGe). That’s the top of the class.
- Electric pickups and big SUVs — an F-150 Lightning or a Rivian R1T runs around 48–50 kWh/100 miles, roughly 2 mi/kWh. A Hummer EV can pass 70 kWh/100 miles, under 1.5 mi/kWh.
So the range in 2026 runs from about 2 to 4 real miles per kWh — a factor of two between the leanest sedan and a heavy truck. A midsize EV returning 3.5 is doing well; a two-ton electric pickup returning 2.1 is doing exactly what physics predicts; and a compact returning 2.5 has something wrong with it.
Which is the benchmark that actually matters: your own car, a few months ago. A vehicle that used to do 3.8 and now does 3.1 on the same commute is telling you about tire pressure, a dragging brake, colder weather, or battery wear — and a slow drift is far easier to catch as a slope on a chart than as a surprise at the charger.
Weather deserves its own warning, because the effect is large and seasonal. In AAA’s 2026 testing, at 20°F the EVs lost 35.6% of their MPGe and 39% of their range; at 95°F they lost about 10% of efficiency (AAA — Temperature Impacts on EV Performance, May 2026). A winter dip in your mi/kWh is usually the thermometer, not a fault — which is exactly why you compare like seasons, not January against July.
What MPGe actually is — and its one honest flaw
You’ll see EVs advertised in MPGe, “miles per gallon of gasoline equivalent.” It exists to answer one question: how does an electric car’s energy use compare to a gas car’s? The EPA fixed a conversion — one gallon of gasoline holds the energy of 33.7 kWh of electricity — so:
MPGe = miles per kWh × 33.7
A car doing 3.5 mi/kWh is rated at about 118 MPGe. A car using exactly 33.7 kWh to go 100 miles is, by definition, 100 MPGe.
MPGe is genuinely useful for one thing — comparing the *energy* efficiency of an EV against a gas car on the same scale — and it has one flaw you should know about. It measures energy, not money. Electricity per unit of energy is usually far cheaper than gasoline per unit of energy, so a 100-MPGe electric car costs much less per mile to run than a 100-MPG gas car would. MPGe tells you which car sips energy; it does not tell you which car is cheaper to drive. For that you need the actual price of a kWh versus a gallon — which is a different calculation.
kWh per mile, Wh per mile, kWh per 100 miles: one fact, several units
Depending on where you look, the same efficiency shows up in four different dresses. Converting is one division each:
- mi/kWh → kWh/100 miles: `100 ÷ (mi/kWh)` — the unit the EPA prints.
- mi/kWh → Wh/mile: `1000 ÷ (mi/kWh)` — common in enthusiast tools.
- mi/kWh → MPGe: `× 33.7`.
| miles/kWh | kWh/100 mi | Wh/mile | ≈ MPGe |
|---|---|---|---|
| 2.0 | 50.0 | 500 | 67 |
| 2.5 | 40.0 | 400 | 84 |
| 3.0 | 33.3 | 333 | 101 |
| 3.5 | 28.6 | 286 | 118 |
| 4.0 | 25.0 | 250 | 135 |
| 4.5 | 22.2 | 222 | 152 |
Notice the kWh/100-mile column shrinks fast at the bottom and slowly at the top: moving from 2.0 to 2.5 mi/kWh saves far more energy over the same distance than moving from 4.0 to 4.5. That asymmetry is invisible in the mi/kWh column, and it’s why making a thirsty EV a little less thirsty matters more than making an efficient one perfect.
Efficiency isn’t cost, and isn’t range
Three metrics get tangled together. Keep them apart and each one answers a clean question:
- Miles per kWh is efficiency: how far the car goes per unit of energy. It answers *”is this car — or this trip — using more energy than it should?”*
- Cost of charging is dollars per kWh, and it swings with where and when you plug in — cheap at home overnight, expensive at a fast charger. Efficiency times price gives you fuel cost; neither number alone does.
- Range is efficiency multiplied by the battery you have to spend: a 75-kWh usable pack at 3.5 mi/kWh is about 260 miles. Improve the efficiency and the range rises with it, on the same battery.
And none of these is the whole picture of what a car costs — depreciation, insurance, tires and servicing usually dwarf the energy. If you want the all-in figure, that’s cost per mile, measured in dollars, not kWh. If you’re coming from a gas car and want the same discipline for that side of the garage, it’s the same method applied to gallons — how to calculate MPG. And most of the boring wins — tire pressure, weight, speed, smoothness, and preconditioning while still plugged in — are the same ones that keep an EV healthy generally.
How I track it in Magica
Working out one charge by hand is easy. Doing it for two years, across a gas car and an EV, without the numbers going missing, is where it falls apart. That’s the part the app handles:
- Refuel and charge log. Date, odometer, energy or volume, price, on the vehicle it belongs to. Gasoline liters and EV kWh both — one history, whichever you’re driving.
- Efficiency calculated from the entries, not guessed — average consumption and the trend over time, so a slow drift shows up as a slope instead of a shock at the charger.
- Your units. miles per kWh or kWh/100 miles, miles or kilometers, set once and applied everywhere.
- Voice entry. “Fifty-eight kilowatt-hours, fourteen dollars” at the charger takes ten seconds, which is the only moment you’ll reliably record it.
- Receipt capture, so the charger total and the log entry are the same object.
- Charging-station map, so you can log where the energy actually came from, not just how much.
- Export to CSV or PDF when the history needs to live somewhere else — a buyer, an accountant, your own spreadsheet.
- On device. The charging history is encrypted on the phone and backed up to your own iCloud, synced between iOS and Android. There’s no Magica server holding it, which is the same principle behind how the app treats trip data.
Honest limitation: the app computes efficiency from what you log, and it can’t tell a wall reading from a battery reading — that part is on you. Pick one basis (I log the kWh the charger says it delivered, because that’s what I paid for) and stay with it, so the trend line compares like with like.

Try Magica for Free
Download the app and start automatically tracking your business trips. No credit card required.
Download Now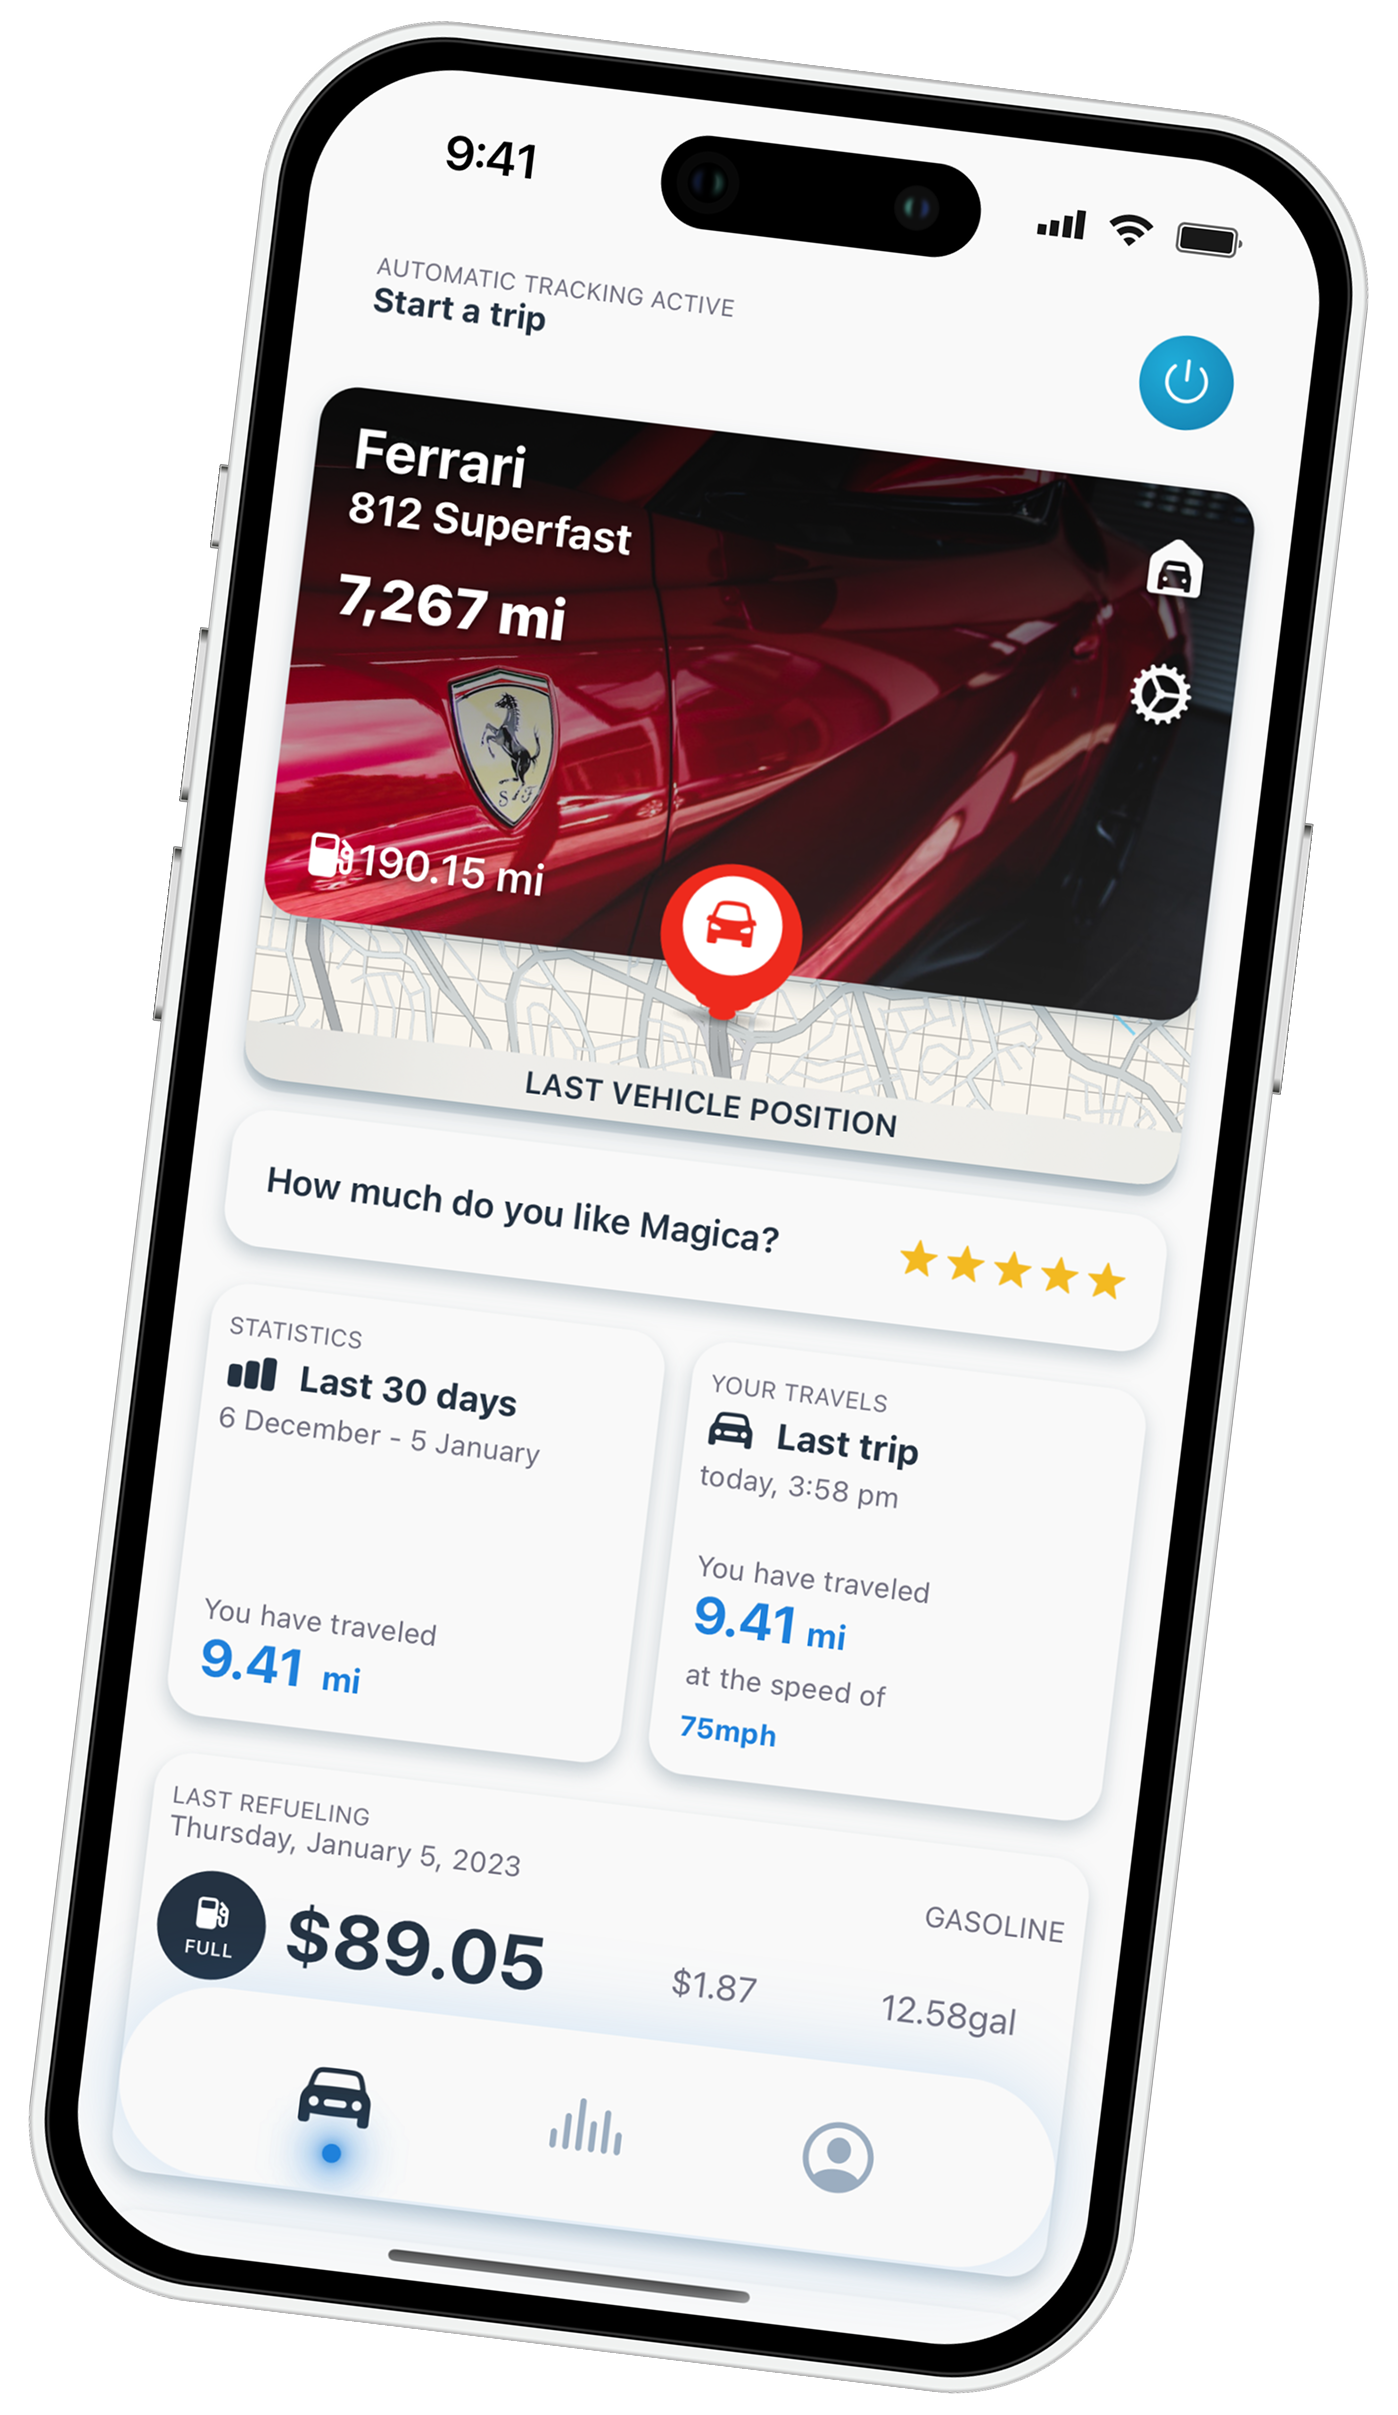
Frequently asked questions
What is a good miles per kWh?
In 2026, real-world EV efficiency runs from about 2 to 4 miles per kWh. Efficient sedans like a Tesla Model 3 or Lucid Air sit near 4 (around 25 kWh/100 miles by EPA ratings); electric pickups like an F-150 Lightning or Rivian R1T sit near 2. A midsize EV doing 3.5 is doing well. The best benchmark is your own car a few months ago, compared season to season.
How do I calculate miles per kWh?
Divide the miles driven by the kWh used: miles ÷ kWh. For a number that reflects what you actually pay, use the kWh drawn from the wall (your charger app, the station receipt, or a plug-in meter), not the figure the car shows — the dashboard counts energy from the battery and leaves out charging losses. 212 miles on 60 kWh from the wall is 3.53 mi/kWh.
Why is my real efficiency lower than the number on the dashboard?
Because they measure at different points. The dashboard counts energy leaving the battery; the wall figure counts energy leaving the socket, and charging isn’t 100% efficient — roughly the low double digits is lost as heat before it reaches the battery. The EPA measures from the wall on purpose, “to better represent how much users would pay to refuel.”
What’s the difference between miles per kWh and MPGe?
They’re the same efficiency in different units. MPGe = miles per kWh × 33.7, because the EPA counts one gallon of gasoline as the energy equivalent of 33.7 kWh. MPGe exists so you can compare an EV’s energy use against a gas car’s — but it measures energy, not money, and electricity is usually cheaper per unit of energy, so a low running cost doesn’t show up in MPGe.
How do I convert miles per kWh to kWh per 100 miles?
Divide 100 by the mi/kWh figure. 3.0 mi/kWh is 33.3 kWh/100 miles; 4.0 is 25.0. For Wh per mile, divide 1000 instead: 4.0 mi/kWh is 250 Wh/mile. Remember the scales run in opposite directions — higher mi/kWh is better, lower kWh/100 miles is better.
Does cold weather really change it that much?
Yes. In AAA’s 2026 testing, at 20°F EVs lost about 36% of their efficiency and 39% of their range, mostly to cabin heating and battery conditioning; hot weather cost around 10%. A winter dip in your miles per kWh is almost always the temperature, not a fault — which is why you compare the same season year over year, not January against June.
Miles per kWh or kWh per mile — which should I use?
Whichever you find easier to reason about; they carry identical information. Miles per kWh (higher is better) reads like MPG and is intuitive for range. kWh per mile — or Wh per mile — (lower is better) matches the EPA’s kWh/100 miles and makes energy differences between cars easier to compare. Pick one and stay consistent so your own history lines up.




3 commenti su “Miles per kWh: How to Measure Your EV’s Real Efficiency (and What MPGe Leaves Out)”
I commenti sono chiusi.