Most Reliable Car Brands in 2026: Four Studies, Four Different Winners, and What They All Miss

In the same twelve months, J.D. Power reported the best year-over-year improvement in new-vehicle quality since 1997 — and the worst three-year dependability score the company has recorded since it redesigned that study in 2022. Both numbers are real, both come from the same firm, and they are not in conflict. They describe different cars at different ages.
That is the whole problem with the phrase most reliable car brands. There are four serious studies of American vehicles in circulation right now, they crown four different winners, and each one is answering a question the others are not asking. One of them ranks Porsche first in the country. Another gives Porsche a 0.5% chance of reaching 250,000 miles. A third does not rank Porsche at all.
I build a mileage and vehicle app, so I have no brand to sell and no dealership to send you to. What follows is what each study actually measures, where they contradict each other, why they contradict each other, and the one thing all four of them leave out — which happens to be the part you control.
The four studies, and the four different questions they ask
Before any ranking makes sense, you need to know what got measured, on which cars, and for how long.
| Study | What it measures | On which cars | Sample |
|---|---|---|---|
| J.D. Power U.S. Initial Quality Study (IQS) | Owner-reported problems in the first 90 days, plus dealer repair data | Brand-new 2026 model-year vehicles | 78,514 owners and lessees |
| J.D. Power U.S. Vehicle Dependability Study (VDS) | Owner-reported problems over the previous 12 months, after three years | 2023 model-year vehicles | 33,268 original owners |
| Consumer Reports brand reliability | Member-reported problems in the previous 12 months across 20 trouble areas | Model years 2000–2025, with a few early 2026 models | About 380,000 vehicles |
| iSeeCars longest-lasting study | Odometer readings: the predicted chance a vehicle reaches 250,000 miles | Used vehicles already on the road | Almost 400 million cars analyzed |
Three of those four never look at a vehicle older than three years. That single fact explains most of the disagreement you are about to see.
How the scores work
J.D. Power counts problems per 100 vehicles (PP100). Lower is better. A problem is anything the owner reports as a problem — a transmission that shudders and a phone that will not pair both count as one.
Consumer Reports weighs severity instead. Its members report trouble over the previous twelve months, the analysts sort it into 20 trouble areas, and each type of problem is weighted by how badly it hits the owner, including expense and whether the car can still be driven safely. The output is a predicted reliability score from 1 to 100.
iSeeCars does not ask anyone anything. It reads odometers on cars listed for sale and calculates the share of each model that is still running at 250,000 miles. The industry average is 4.8%.
Four methods, four units, four different definitions of the word “reliable.”
Four studies, four winners
Here is what each one crowned in its most recent edition.
J.D. Power IQS 2026 (90 days, released June 2026). Porsche ranks highest overall, at 138 PP100, and the Porsche 911 is the top-scoring individual model in the country at 110 PP100. Among premium brands Genesis is second (151) and Lexus third (156). Among mass market brands, Ford ranks first at 152 PP100, with Nissan second (156) and Buick third (162). Overall new-vehicle quality improved to 175 PP100 from 192 a year earlier — the fourth-best result in the study’s 40-year history.
J.D. Power VDS 2026 (three years, released February 2026). Lexus ranks highest among premium brands at 151 PP100, for a fourth consecutive year, with Cadillac second (175) and Porsche third (182). Buick ranks highest among mass market brands at 160 PP100, for a second consecutive year, with MINI second (168) and Chevrolet third (178). The industry average was 204 PP100, two worse than the previous year, and the highest problem count recorded since the 2022 redesign. Toyota Motor Corporation took the most model-level awards, eight of them, and the top overall model in the study was the Lexus IS.
Consumer Reports 2026 (updated December 2025). Lexus, Subaru and Toyota lead the brand reliability ranking for the second consecutive year, with Honda and BMW completing the top five. Tesla made the biggest jump, up eight places to ninth. Mazda fell eight places. The five lowest-ranked brands are all domestic: Chrysler, GMC, Jeep, Ram and Rivian.
iSeeCars (longest-lasting brands). Only four brands out of 32 beat the 4.8% average chance of reaching a quarter-million miles: Toyota at 17.8%, Lexus at 12.8%, Honda at 10.8% and Acura at 7.2%. The other 28 brands are all below average. At model level the Toyota Sequoia leads at 39.1%, more than eight times the industry average.
Read those four paragraphs again and notice that the word “first” lands on Porsche, Ford, Lexus, Buick, Toyota and Subaru depending on which page you opened.
The three brands that show why the rankings fight each other
Averages hide it. Individual brands make it obvious.
Porsche. Highest-ranked brand in America for initial quality, 138 PP100 at 90 days. In the three-year study it slips to third among premium brands, at 182. In the iSeeCars longevity data it sits at 0.5% — 24th of 32 brands, one-tenth of the industry average. And Consumer Reports does not rank it at all: Porsche is on the list of brands excluded for insufficient sample, alongside Alfa Romeo, Dodge, Fiat, Infiniti, Jaguar, Land Rover, Lucid, Maserati, Mini, Mitsubishi and Polestar.
Buick. Highest-ranked mass market brand at three years, 160 PP100, two years running, and the highest-scoring domestic brand at Consumer Reports in eighth place. In the longevity data Buick scores 0.6%, 23rd of 32, roughly one-eighth of the average.
MINI. Second-best mass market brand at three years, 168 PP100. In the longevity data MINI is at 0.0%, tied for last. Consumer Reports also excludes it for sample size.
None of these three numbers is wrong. They answer different questions:
- How many things annoyed the owner in the first three years? That is J.D. Power, and a Porsche owner reports few.
- How many of these cars are still running past 250,000 miles? That is iSeeCars, and very few Porsches are, partly because very few Porsches are asked to.
iSeeCars says the quiet part out loud in its own analysis of luxury vehicles: they are not driven as hard as mainstream cars, the average luxury vehicle’s chance of hitting 250,000 miles is only 3.2% against 5.1% for non-luxury, and for those cars “time – not mechanical failure – is the primary factor ending the lifespan of luxury vehicles.” A car that gets scrapped at fifteen years and 90,000 miles never had a chance to prove anything about durability.
Where two studies do agree, pay attention
The Lexus IS is the top-ranked individual model in the J.D. Power three-year dependability study and fifth in the iSeeCars longevity list, with a 27.5% chance of passing 250,000 miles — nearly six times the average. Toyota takes the most model awards at three years and dominates the longevity list with ten of the top 25 models.
When a survey of owner complaints and a database of odometer readings point at the same badge, that is two unrelated methods agreeing. That is worth more than any single first place.
The most common “reliability problem” in an American car is a phone
This is the finding that should change how you read every PP100 number you see.
In the 2026 dependability study, the single most frequently reported problem in the entire industry — for the third consecutive year — is Android Auto and Apple CarPlay connectivity, at 8.9 PP100. Four of the top five industry problems are about connecting a phone to the car. Add built-in Bluetooth (5.5 PP100), wireless charging pads (5.1) and the manufacturer’s own app (4.7) and you get 24.2 PP100, close to half of the entire infotainment category, which at 56.7 PP100 is by far the worst of the nine categories measured.
The initial quality study tells the same story from the other end. Everything improved this year except infotainment, and inside infotainment the largest single contributor to the decline was CarPlay and Android Auto connectivity, up 1.4 PP100. Meanwhile the biggest single contributor to the improvement in initial quality was, in the study’s own words, cupholders.
So when a brand loses a reliability ranking, ask which category it lost. A car can post a poor PP100 score without a single mechanical failure — and a car can post a decent one while the powertrain quietly ages. Software updates do not help as much as you would think either: 40% of owners received one in the past year, only 27% felt it improved the vehicle, and 58% noticed no difference at all.
There is a safety footnote in the same data that deserves its own line. Among owners who reported a distraction-related problem, 46% said the distraction came from the infotainment system or touchscreen, against 18% from driver assistance alerts.
Premium wins at 90 days and loses at three years
Put the two J.D. Power studies side by side and a pattern appears that neither press release states outright.
| Premium brands | Mass market brands | |
|---|---|---|
| First 90 days (IQS 2026) | 169 PP100 | 177 PP100 |
| After three years (VDS 2026) | 217 PP100 | 200 PP100 |
At delivery, premium cars have fewer problems. Three years later they have considerably more — the gap has widened to 17 PP100, and premium underperforms mass market in seven of the nine categories measured, with only powertrain and seats going the other way. Premium problems jumped 8 PP100 year over year, the worst reading since the study was redesigned.
Consumer Reports sees the geography of the same effect: Asian brands average 56 out of 100 for reliability, European brands 50, domestic brands 41.
The practical translation: a car that impresses on the test drive and in the first year is telling you about assembly quality and software polish. It is telling you very little about year six.
Electrified powertrains: three studies pointing the same way, with one exception
This is the rare area where the studies broadly agree, so the signal is strong.
J.D. Power’s three-year data ranks powertrains like this:
| Powertrain | PP100 after three years | Year-over-year |
|---|---|---|
| Plug-in hybrid | 281 | +39 |
| Battery electric | 237 | +14 |
| Hybrid | 213 | +14 |
| Gasoline | 198 | −2 |
Consumer Reports arrives at the same ordering by a different route: of the 26 brands it ranked, 13 of the least reliable models are either an EV or a plug-in hybrid, and not a single conventional hybrid appears on that list. Within a single model line, the plug-in version usually scores below both the hybrid and the gas-only version.
Two useful nuances rather than a verdict:
- Conventional hybrids are the exception, not the rule. Manufacturers that have built them for two decades produce hybrid versions that score at or above the gas-only version. Hybrids also show up in the longevity data: five of the 25 longest-lasting models are hybrids, up from three the year before and zero in 2023, and the Toyota Highlander Hybrid ranks third overall at 31.0%.
- Shared parts spread problems. Consumer Reports traced repeated electrical trouble across Hyundai, Kia and Genesis EVs to one shared component, the integrated charging control unit, and found most models on General Motors’ Ultium platform scoring below or well below average. When brands share hardware, a reliability ranking by badge tells you less than it appears to.
If you drive electric, the number that matters day to day is not a PP100 score anyway — it is what the car actually returns per kilowatt-hour, which is something you can only learn from your own data.
Every one of these rankings measures a young car. Yours is not.
Here is the gap none of the four studies covers, and it is enormous.
According to S&P Global Mobility, the average age of light vehicles in the United States reached 12.8 years, rising two months for the second consecutive year. Split by type, the average passenger car is 14.5 years old and the average light truck 11.9. There are 289 million vehicles in operation, the scrappage rate is a steady 4.5%, and passenger cars dropped below 100 million for the first time since the 1970s.
Now line that up against what gets measured:
- Initial quality: 90 days.
- Dependability: three years, on 2023 model-year cars.
- Consumer Reports brand scores: averaged over 2023 to 2025 models, with some early 2026 data.
The newest, most-quoted reliability data in America covers roughly the first three years of a vehicle that will spend, on average, nearly thirteen years on the road. The rankings describe the warranty period. You will own the car for the other decade.
Only the odometer studies look at that decade, and they are blunt about what they are doing. The depreciation studies are not, and comparing iSeeCars with Kelley Blue Book’s awards opens a 13.5-point gap on the same question — the comparison is in best cars for resale value. iSeeCars notes that its longevity list is not a maximum lifespan, it is “simply a measure of current odometer readings” on cars that are, for the most part, still in use. The top 20 models sit between 230,547 and 296,509 miles at the 1% mark — one in a hundred Toyota Sequoias on the road today has at least 296,509 miles on it.
And the sentence in that study that no brand ranking can give you: those vehicles are capable of a quarter-million miles of use “if properly maintained.”
That is the variable. Not the badge — or not only the badge.
What actually moves the odds after year three
Four things, all supported by the data above, and all of them decided after you buy.
1. Do not buy the first year of a redesign. Consumer Reports is unambiguous: if you want to avoid reliability problems, do not buy an all-new or redesigned model. Its 2026 data shows several redesigned SUVs at well-below-average scores, and — the part people miss — even second-year examples of a bad launch often stay bad, because it takes the manufacturer more than a model year to fix them.
2. Body type matters more than most rankings admit. In the Consumer Reports data, cars (sedans, hatchbacks, wagons) average 58 out of 100, SUVs and minivans 46, and pickups 44. In the longevity data the ordering flips, because trucks and three-row SUVs are the ones asked to do 250,000 miles in the first place. Both are true: the vehicles that accumulate the most miles also accumulate the most problems.
3. Age beats badge. The spread between the best and worst brand in any of these rankings is a few points. The spread between a three-year-old car and a thirteen-year-old car is the difference between a study population and a repair bill. This is why what a service actually costs, brand by brand is a more useful number for a car you already own than any reliability ranking.
4. Maintenance is the only input you fully control. Every study above measures an outcome. Maintenance is the one variable on the input side that is entirely yours — and, as the next section shows, federal law turns your record of it into leverage.
Two federal rules that make your service records worth money
Most “most reliable brands” articles stop at the rankings. This part is worth more than the rankings, and it is barely ever written down.
You are not required to service at the dealer
The Magnuson-Moss Warranty Act is explicit:
“No warrantor of a consumer product may condition his written or implied warranty of such product on the consumer’s using, in connection with such product, any article or service (other than article or service provided without charge under the terms of the warranty) which is identified by brand, trade, or corporate name.”
— 15 U.S.C. § 2302(c)
The Federal Trade Commission’s interpretation of that section spells out the automotive case and even quotes the offending clause verbatim as an example of what is prohibited: “This warranty is void if service is performed by anyone other than an authorized `ABC’ dealer and all replacement parts must be genuine `ABC’ parts” (16 CFR § 700.10(c)). The same rule states that no warrantor may condition the continued validity of a warranty on the use of authorized service or authorized parts for non-warranty service and maintenance.
But the manufacturer can still deny a claim — and here is the exact test
The same regulation closes with the sentence that matters most, and almost nobody quotes it:
“This does not preclude a warrantor from expressly excluding liability for defects or damage caused by ‘unauthorized’ articles or service; nor does it preclude the warrantor from denying liability where the warrantor can demonstrate that the defect or damage was so caused.”
— 16 CFR § 700.10(c)
Read the burden carefully. The manufacturer may deny a claim where it can demonstrate that the outside service or part caused the damage. That is a factual argument, and factual arguments are won with dated records: what was done, when, at what mileage, with which parts, and by whom.
The eight-year warranty most people never claim
There is a second warranty on your car that has nothing to do with the manufacturer’s goodwill, because Congress wrote it. Under the Clean Air Act, the emissions warranty period for light-duty vehicles is two years or 24,000 miles, except for a “specified major emission control component,” where it becomes eight years or 80,000 miles. The statute defines that term narrowly:
“only a catalytic converter, an electronic emissions control unit, and an onboard emissions diagnostic device”
— 42 U.S.C. § 7541(i)(2)
Those are three of the most expensive parts on a modern car, and they are exactly the parts that trigger a check engine light long after the bumper-to-bumper coverage has expired.
The condition attached to that warranty is the reason this section exists. It applies where “the vehicle or engine is maintained and operated in accordance with instructions” (42 U.S.C. § 7541(b)(2)). And the same paragraph blocks the obvious dealer counterargument about aftermarket parts: “No such warranty shall be invalid on the basis of any part used in the maintenance or repair of a vehicle or engine if such part was certified as provided under subsection (a)(2).”
So the position the law puts you in is this: you may service the car wherever you like, with certified parts, and keep an eight-year emissions warranty alive — as long as you can show the maintenance was done. A shoebox of faded thermal receipts is a weak way to show it. A dated log with the odometer reading on every entry is a strong one.
This is a summary of two federal rules, not legal advice; a specific warranty dispute deserves a professional read of your actual contract.
Where Magica fits, honestly
I did not build a reliability database and I am not going to pretend the app predicts which brand will last. Nobody’s app does that.
What it does is the unglamorous half of everything above. Magica keeps a maintenance log with dates, costs and odometer readings, stores scanned receipts against each entry, and sends reminders for scheduled service, inspections and insurance renewals before they lapse. It also produces a maintenance report showing the cost and frequency of interventions on your own vehicle, which is a far more honest reliability rating than any national average, because the sample size is one and the sample is yours. What belongs in that log, and what federal law says about who may perform the work, is in car maintenance schedule.
Two details that matter here. Everything stays on the device — no account, no server of mine holding your service history — and the whole record exports as PDF or CSV, which is the form you actually need when a warranty claim, a dealer or a buyer asks for proof.
That is the entire pitch: the studies measure other people’s cars for three years, and this measures yours for as long as you own it. If you want the deeper version of what to record and why, I wrote a full guide to keeping a car maintenance log.

Try Magica for Free
Download the app and start automatically tracking your business trips. No credit card required.
Download Now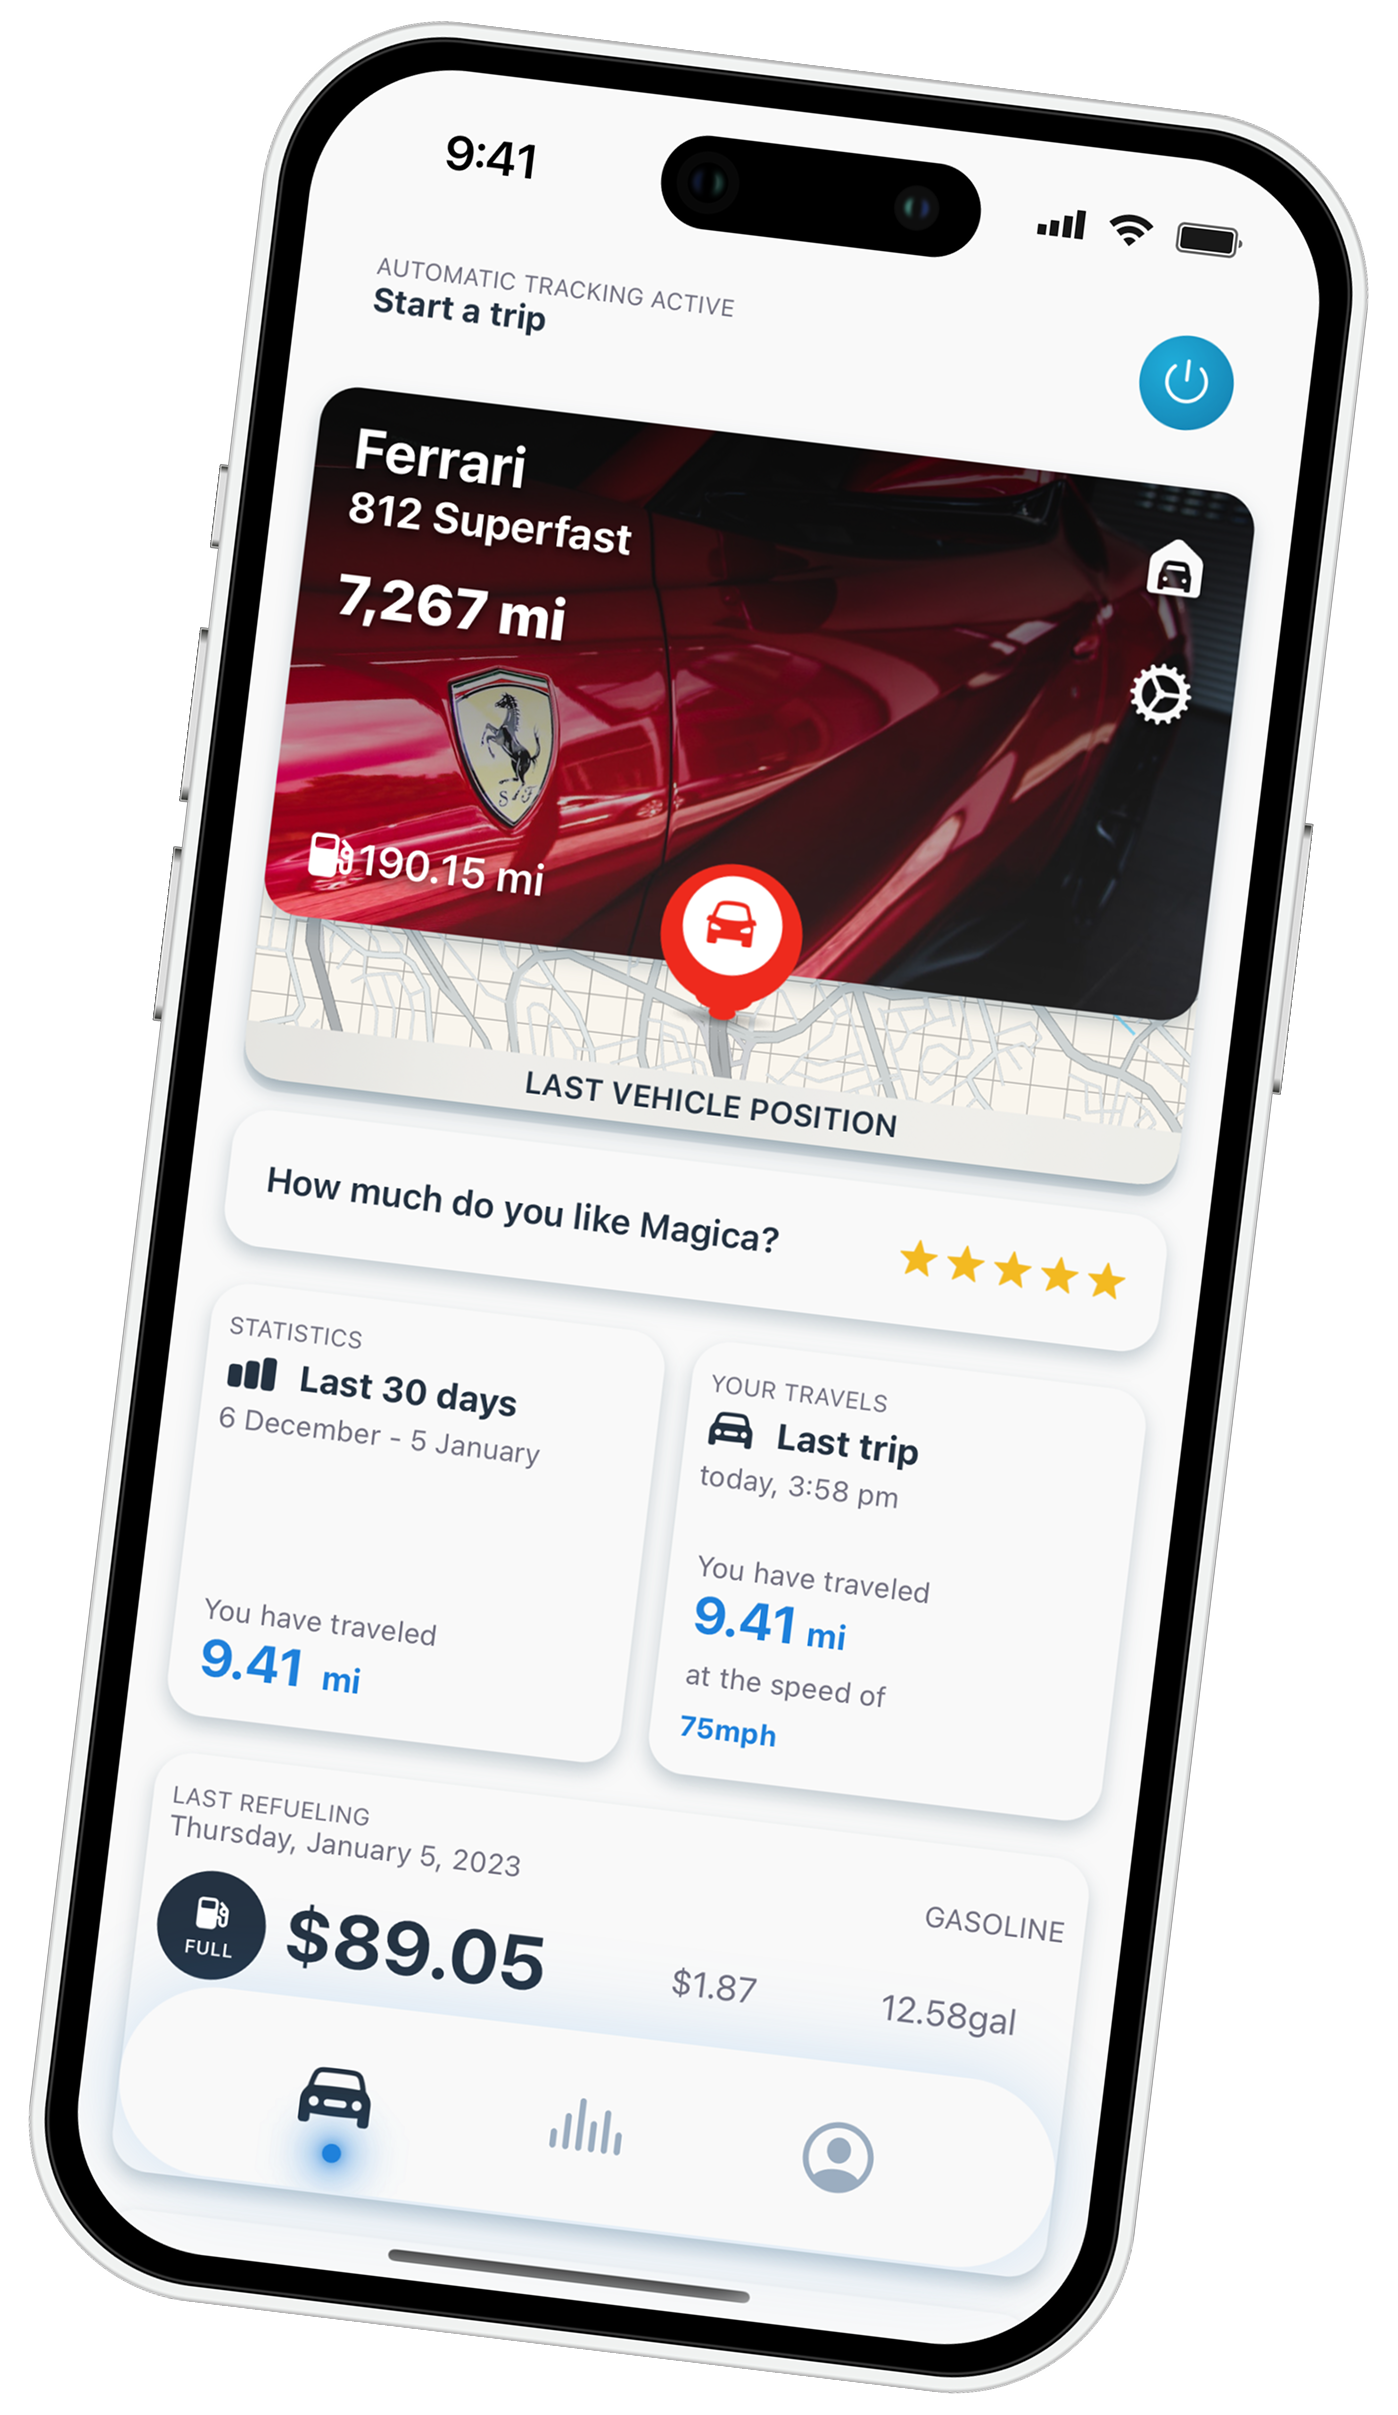
So which brand should you actually buy?
If you want the shortest defensible answer the data supports: the badges that show up at the top of more than one methodology are the safer bets — Toyota, Lexus and Honda appear at or near the top of both the survey-based rankings and the odometer-based ones, and that agreement across unrelated methods is stronger evidence than any single first place.
But the more useful answer is that the question is slightly wrong. A ranking is a forecast about a population. Once the car is in your driveway, you are a sample of one, and your outcome is decided by three things the ranking never saw: whether you bought the first year of a redesign, how the previous owner treated it if it is used, and whether the maintenance actually gets done and recorded.
If you are still choosing, how to work out the real cost of a used car will tell you more than a brand ranking, and if you are deciding between owning and leasing, that comparison has its own rules — including a mileage cap that turns the longevity question upside down.
And once you own it, the number that predicts your next five years is your own cost per mile, not a national average.
Try Magica for Free
Download the app and start automatically tracking your business trips. No credit card required.
Download Now
Frequently asked questions
What are the most reliable car brands in 2026?
It depends on the study. Consumer Reports puts Lexus, Subaru and Toyota at the top. J.D. Power’s three-year dependability study ranks Lexus highest among premium brands and Buick highest among mass market brands. J.D. Power’s 90-day quality study ranks Porsche highest overall and Ford highest in the mass market. iSeeCars, which measures odometer readings rather than complaints, finds only Toyota, Lexus, Honda and Acura above the industry average chance of reaching 250,000 miles. Toyota and Lexus are the two names that appear near the top of more than one method.
Why do reliability rankings disagree with each other?
Because they measure different things on different cars. Initial quality covers 90 days on brand-new vehicles, dependability covers three-year-old vehicles, Consumer Reports weighs the severity of problems reported over the previous twelve months, and iSeeCars counts how many cars are still running at a quarter-million miles. A brand can look excellent on one of those definitions and poor on another without any of the numbers being wrong.
Is a car with more problems per 100 vehicles actually less dependable?
Not necessarily in the mechanical sense. In the 2026 dependability study the single most frequent problem in the industry, for the third year running, is Apple CarPlay and Android Auto connectivity at 8.9 PP100, and infotainment is the worst-scoring category by a wide margin. A problem counted in that score can be a phone that will not pair, not a component that failed.
Are electric cars less reliable than gas cars?
On the current data, electrified powertrains report more problems. After three years, plug-in hybrids score 281 PP100, battery electrics 237 and hybrids 213, against 198 for gasoline vehicles. Consumer Reports finds the same pattern, with one clear exception: conventional hybrids, which score well and appear in the longevity rankings. Shared components matter too — several unrelated brands have posted poor EV scores because they use the same part.
How long does a car actually last?
Longer than most rankings measure. The average light vehicle in the United States is 12.8 years old, and the average passenger car 14.5 years. In the odometer data, the top 20 longest-lasting models show one in a hundred examples between roughly 230,000 and 296,000 miles. But the average vehicle has only a 4.8% chance of reaching 250,000 miles, and the study attaches an explicit condition to those figures: proper maintenance.
Does servicing my car outside the dealer void the warranty?
No. Federal law prohibits conditioning a warranty on the use of a service or part identified by brand name unless it is provided free, and the FTC’s interpretation names the “void if serviced by anyone other than an authorized dealer” clause as prohibited. What the manufacturer can still do is deny a specific claim where it can demonstrate that outside service or parts caused the damage — which is why dated maintenance records with mileage matter.
What is the eight-year warranty on emissions parts?
Under the Clean Air Act, light-duty vehicles carry an emissions warranty of two years or 24,000 miles, extended to eight years or 80,000 miles for a “specified major emission control component,” defined as only a catalytic converter, an electronic emissions control unit and an onboard emissions diagnostic device. It applies where the vehicle has been maintained and operated according to the manufacturer’s instructions, and it cannot be invalidated merely because a certified aftermarket part was used.
Should I buy the first model year of a redesign?
Consumer Reports advises against it, and its 2026 data supports the advice: several newly redesigned models score below or well below average, and second-year examples of a troubled launch frequently stay troubled, because fixes take more than one model year to reach production. Waiting one or two years after a redesign is one of the few reliability decisions available to a buyer that costs nothing.




5 commenti su “Most Reliable Car Brands in 2026: Four Studies, Four Different Winners, and What They All Miss”
I commenti sono chiusi.